…it’s not just OEMs…
Costs in the Japanese auto industry
Posted in Posts
Monday I was at the award ceremony for the Automotive News PACE Supplier of the Year competition, for which I’ve been a judge for the past 19 years; more on that in a later post. On Friday (19 April) I spoke on the Japanese auto industry at an UMTRI conference in Ann Arbor, Michigan. One data point was an overview of the industry; since I begin a new (4-week) term tomorrow (22 April), let me elaborate as indirect class preparation.
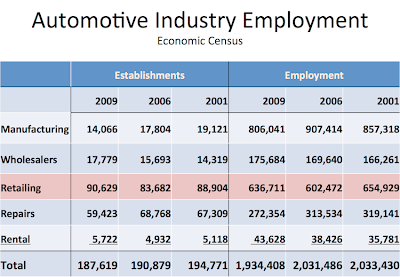
The auto industry is not just OEMs, but encompasses dealers and parts suppliers. For Japan, the Economic Census provides an overview of employment of various subdivisions. As in the US, the downstream industry is the largest source of employment. (Note I’m puzzled by the large level of employment at wholesalers; I have no answer.)
| Automotive Assembly |
Vehicle Bodies |
Automotive Parts |
|
| Establishments | |||
| 2006 | 51 | 201 | 8,799 |
| 2007 | 66 | 210 | 8,979 |
| 2008 | 67 | 221 | 8,921 |
| 2009 | 72 | 198 | 7,996 |
| 2010 | 72 | 170 | 7,812 |
| Employment | |||
| 2006 | 176,662 | 39,661 | 633,297 |
| 2007 | 182,993 | 18,842 | 693,322 |
| 2008 | 182,707 | 18,503 | 664,257 |
| 2009 | 166,479 | 15,513 | 604,644 |
| 2010 | 161,158 | 13,402 | 612,193 |
| Annual per worker cash compensation, ¥ million | |||
| 2006 | 7.47 | 6.65 | 5.13 |
| 2007 | 7.32 | 5.05 | 5.25 |
| 2008 | 7.57 | 4.89 | 5.47 |
| 2009 | 6.92 | 4.73 | 4.92 |
| 2010 | 7.08 | 4.59 | 5.10 |
| 500+ workers | 7.11 | 4.77 | 6.39 |
| Source: Census of Manufactures (工業統計表). Wages are cash compensation divided by employment in establishments | |||
Within manufacturing, the parts sector is the largest by about a factor of three. That’s consistent with the US, where Thomas Klier and James Rubenstein found about a 3:1 ratio (Who Really Made Your Car? Restructuring and Geographic Change in the Auto Industry, Upjohn Institute Press, 2008). Now Census data represent classifications by those reporting, so miss the full count. In addition, I didn’t include categories (e.g., piston rings) that aren’t reported under “autos”; Klier and Rubenstein work with a much more comprehensive set of data. Hence the table at right underreports parts employment.
Finally, I include very rough data on compensation; mandatory benefits add at least another 20%. These data, alongside the employment data, provide a sense of the sharp downturn in 2009-2010, under the impact of the Lehman Shock (as it’s called in Japanese). Reflecting lower bonuses (in larger firms the norm is 4.5 months or more pay) and cuts to overtime, compensation fell sharply in those years. I also give a row for cash compensation restricted to the largest size establishments; such locations would in almost all cases be unionized (though contingent workers – contract and part-time employees – would not normally be members and would receive lower pay and benefits).
Now as I write this the exchange rate is ¥99.8/US$1.00, or ¥1 is equivalent to a penny at market exchange rates. The average parts worker in a larger establishment, which account for 2/3rds of output, is thus about $64,000. Add in mandatory benefits and that rises to $76,000. Even at the April 21st exchange rate, that is far higher than the US; at the ¥80 level of last year, that would have been ¥95,000. While this would include engineers, at least if they were located in a manufacturing facility, it is a tidy sum. And it has obvious implications: even if the average worker is more productive than their US equivalent, Japanese workers have (on average) priced themselves out of the global market.
…Mike Smitka…
